
TDDD04 Software Testing
Lab 2: Symbolic execution and test-case generation
Purpose
This lab assignment will help you develop an understanding of contemporary tools and techniques that can be used to assess program behavior and generate test cases. You will use a research tool called JPF, which is used in Software Engineering research on the analysis of program behavior.UPDATE: if you are running the lab on your own machine, you need to have the same JDK as the lab machines which is 11. Then run the lab with compatibility with Java 1.8 (you can change this in the path configurations).
Introduction
Java Pathfinder is developed as a joint research project, to create a platform for symbolic execution, test-case generation and verification of software. It has been used in a number of research projects and is available as open source software that can be used for many different kinds of software analysis. In this lab assignment, you will work with the specific JPF projectsjpf-core
and jpf-symbc. You
will follow a series of tutorial assignments pertaining to the use of
JPF, and the symbolic execution engine in jpf-symbc, and answer
questions related to the technology underlying them.
Preparations
First, you need to clone the Eclipse project in your Eclipse workspace, and create an Eclipse project with the same name as the project ("jpf-test"). By creating a project with the same name, Eclipse will import the existing project and any settings that we have already made, such as setting the classpath to a suitable value for our SU lab rooms.Note: the project settings are set to both use the JRE 1.8 for compilation and compliance. If you get warnings about unresolved paths, check the compiler compliance is set to 1.8 in the project properties.
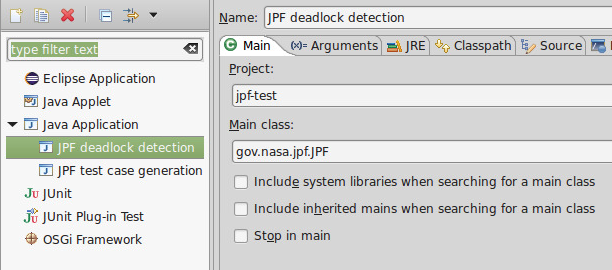
Using JPF means that you launch the JPF virtual machine and pass parameters, either using command line switches or property files, to determine the behavior you would like. For each of the scenarios below, we want you to use an Eclipse launch configurations to determine the invocation of JPF. Common to all of them is that you launch the JPF main class (see picture below).
During the execution of your program, JPF can monitor events in your program that would cause the program to throw an uncaught exception, manipulate how bytecode instructions are to be interpreted, and in general use the concept of listeners (see the documentation in the jpf-core project for more information) to verify program behavior.
Before you proceed, please read the instructions on the JPF main project page on
You need to be using Java 1.8 with JPF and to make sure all the libraries for JPF are in the class path.By default, there are some configuration options that you will need
to use for all the exercises below, as parameters specified in the
launch configuration to JPF. First, you will need to specify
the classpath that JPF will use when searching for your
classes. Second, you will need to specify the main class of your
program, as a point of entry for JPF. It may look something like this,
for the main class race.Deadlock:
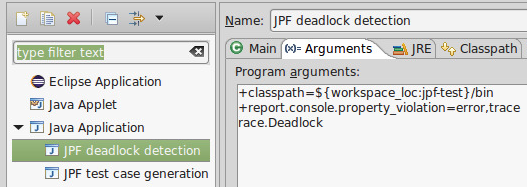
+classpath=${workspace_loc:jpf-test}/bin
race.Deadlock
Here is an example of how these parameters would be specified in a
launch configuration in Eclipse:
Concurrency testing 1: Deadlock detection
The classrace.Deadlock contains two classes
Updater1 and Updater2 that attempt to modify
the same Pair object. However, in doing so they lock the
two fields x and y in different order, possibly causing a deadlock
during execution. A deadlock prevents either thread from executing as
they have both locked resources for one another.
JPF is configured to detect deadlocks by default (see the "Properties" section of the jpf-core documentation).
The configuration options that you will find useful for this excercise are probably those related to the report you get at the end:
+report.console.property_violation=error,traceThis option indicates that you will get a stack trace of any exceptions, as well as a detailed error description from JPF. Create a launch configuration for detecting possible deadlocks in the code, and run it in order to note the results.
Questions to answer
- How would you have found the error in the program if you had not used JPF?
- How does JPF find the deadlock? Use information from the trace printouts from the program as well as the description of how JPF works to justify your answer.
Concurrency testing 2: Race condition detection
The second concurrency test concerns race conditions. Race conditions appear when two threads want to modify the same resource, and the result of the program depends on the (random) order in which the threads are scheduled to run. We have a classrace.Resource where two threads update a common value,
and where the order in which they run determine the outcome. Apart
from the general parameters, in this case we want to specify that a
particular listener should be used, one that can detect race
conditions.
+listener=gov.nasa.jpf.listener.PreciseRaceDetectorQuestions to answer
- How would you have found the error in the program if you had not used JPF?
- What happens if you make the
Updater.runorPair.updatemethodssynchronized? Why?
Symbolic execution 1: Test case generation with exceptions
JPF can use symbolic execution for exploring a number of different execution paths of a program at runtime. The documentation of the JPF modulejpf-symbc describes how this works
in general, and what parameters are of use. In this task, you will
generate test cases for the class triangle.Main by using
parameters to set up JPF for probing different execution paths in the
program.
+vm.insn_factory.class=gov.nasa.jpf.symbc.SymbolicInstructionFactory
+listener=gov.nasa.jpf.symbc.SymbolicListener,gov.nasa.jpf.symbc.sequences.SymbolicSequenceListener
+symbolic.method=triangle.Triangle.getType(sym#sym#sym)
Questions to answer
- What happens if you change the
Triangle.getTypemethod to not throw exceptions on invalid parameters but returnTriangleType.NaTinstead? - What test cases are generated if you replace the exception?
- What happens if you change
getType(sym#sym#sym)togetType(con#con#sym)? - What does the notation
getType(con#con#sym)mean and what is the effect on the generated test cases? How do you think it could be used when probing the program for execution paths?
Symbolic execution 2: Test case generation with coverage analysis
Another listener that can be used is thegov.nasa.jpf.listener.CoverageAnalyzer that can provide
information on the coverage that you will get from the test cases
generated. In this excercise, you will use the method
dataflow.Billing.calculateBill(int) as a target for your
test case generation.
+vm.insn_factory.class=gov.nasa.jpf.symbc.SymbolicInstructionFactory
+listener=gov.nasa.jpf.symbc.SymbolicListener,gov.nasa.jpf.symbc.sequences.SymbolicSequenceListener,gov.nasa.jpf.listener.CoverageAnalyzer
+coverage.include=dataflow.Billing
+coverage.show_requirements=true
+symbolic.method=dataflow.Billing.calculateBill(sym)
Questions to answer
- How does the
SymbolicSequenceListenerseem to select test case input values? - Do you get 100% statement coverage from the test cases? If not, why do you think that is so? Hint: consider the configuration parameters to the jpf.symbc package on how to select symbolic values for different datatypes.
- Does the coverage indication provided by the CoverageAnalyzer seem correct to you? Justify your answer.
Last excercise: Experimentation
Look at the code examples in the directorysir_examples,
used in software analysis research. These examples contain seeded
bugs that a software analysis tool such as JPF should be able to
find. The code examples are packaged in a standardized way suitable
for experimentation, which means there is more information than merely
the source code. You find the code in the directories called
version.alt though.
- Try to find the bugs in the code examples
alarmclockandlog4j2, and describe them. In thelog4j2example, there are two versions of the code, so you should be able to make out where the difference lies between the two version using thedifftool. In the alarmclock example, you should be able to explain the bug that JPF detects by inspecting the code that triggers the detected exception.
Reporting your results
See the general instructions for successfully completing the lab assignment. Your report should include the traces from the different tests you ran and provide the answers to the questions above, and describe the bugs in the last exercise as precisely as you can.
Page responsible: Lena Buffoni
Last updated: 2021-08-26
