Wireshark Lab: TCP |
| By Farrokh Ghani Zadegan,
Vengatanathan Krishnamoorthi, Rahul Hiran and
Niklas Carlsson. This lab assignment is partly based on "Wireshark Lab: TCP", by J.F. Kurose and K.W. Ross, available here. Revised and updated by Carl Magnus Bruhner. Last updated August 2020 (based on v8.0). |
Contents
- Overview of the Assignment
- TCP Basics
- TCP Congestion Control in Action
- A Short Study of Fairness in TCP Connections
- Demonstration and Report
In this lab, we’ll investigate the behavior of the celebrated TCP protocol in detail. We’ll do so by analyzing a trace of the TCP segments sent and received in transferring a 150KB file (containing the text of Lewis Carrol’s Alice’s Adventures in Wonderland) from your computer to a remote server. We’ll study TCP’s use of sequence and acknowledgement numbers for providing reliable data transfer; we’ll see TCP’s congestion control algorithm – slow start and congestion avoidance – in action; and we’ll look at TCP’s receiver-advertised flow control mechanism. We’ll also briefly consider TCP connection setup and we’ll investigate the performance (throughput and round-trip time) of the TCP connection between your computer and the server. Finally, we'll take a quick look at TCP connection fariness.
Before beginning this lab, you’ll probably want to review sections 3.5 and 3.7 in the text book Computer Networking: A Top-Down Approach (7th or 8th Ed).
To carry out the assignment, you should download and extract the files from the last assignment (found here or locally).
In this assignment, you will be asked to answer and/or discuss a number of questions. To save time, it is important that you carefully read the instructions such that you provide answers in the desired format(s).
First, you will analyze the provided Wireshark trace file tcp-ethereal-trace-1. This trace file is captured during uploading a 150KB text file to a Web server through the HTTP POST method. Run Wireshark and open the above trace file. Filter the packets displayed in the Wireshark window by entering “tcp” (lowercase, no quotes, and don’t forget to press return after entering!) into the display filter specification window towards the top of the Wireshark window.
| Note: After you've changed the expression in the filter input box, do not forget to press the Apply button (or the Enter/Return key twice), to apply this filter string to the displayed trace file. |
What you should see is series of TCP and HTTP messages between your computer and gaia.cs.umass.edu. You should see the initial three-way handshake (packet numbers 1, 2 and 3) containing a SYN message. You should see an HTTP POST message. Depending on the version of Wireshark you are using, you might see a series of “HTTP Continuation” messages being sent from your computer to gaia.cs.umass.edu. Recall from our discussion in the earlier HTTP Wireshark lab, that is no such thing as an HTTP Continuation message – this is Wireshark’s way of indicating that there are multiple TCP segments being used to carry a single HTTP message. In more recent versions of Wireshark, you’ll see “[TCP segment of a reassembled PDU]” in the Info column of the Wireshark display to indicate that this TCP segment contained data that belonged to an upper layer protocol message (in our case here, HTTP). You should also see TCP ACK segments being returned from gaia.cs.umass.edu to your computer.
To find out which packet contains the actual POST request (i.e. which packet is the start of HTTP data transmission) you can use the Find Packet feature of Wireshark (choose Edit->Find Packet...), which is shown in Figure 1.
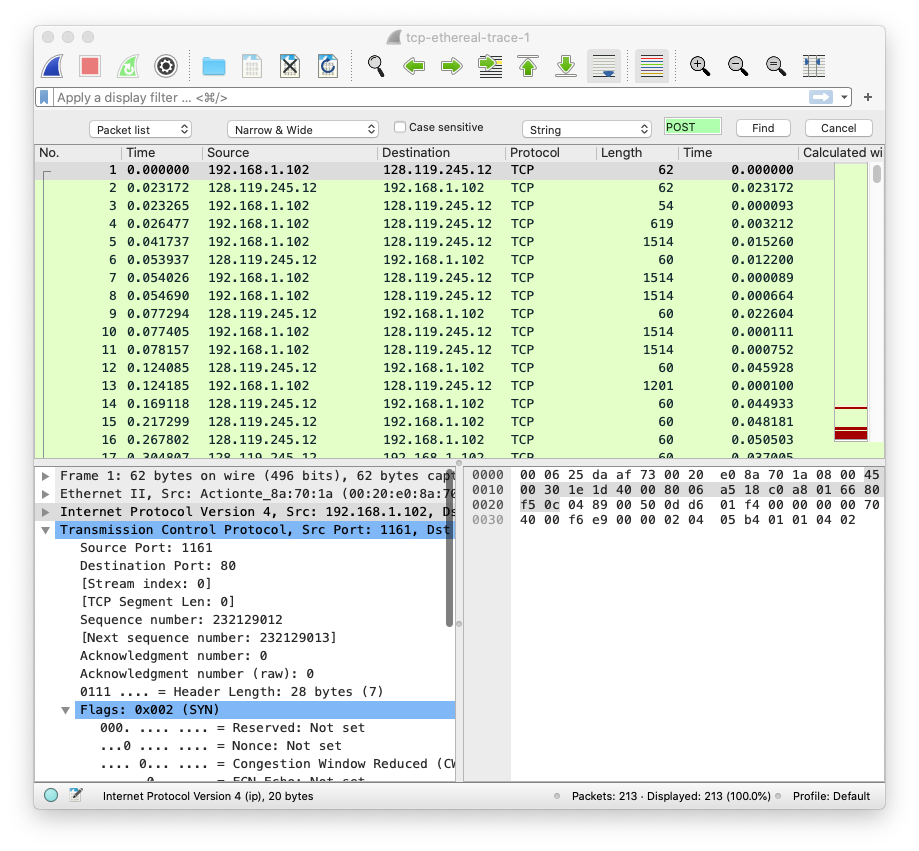 |
| Figure 1: The Find Packet feature in Wireshark, displayed as a bar under the filter. |
Next, please consider the following practice questions. When needed, take screenshots or print out the packet(s) and annotate it to explain your answer. To print out packet information you can use File->Print, choose Selected packet only, choose Packet summary line, and select the minimum amount of packet details that you need to answer the questions. Hand in such screenshots/printouts along with your answers.
|
Note 1: In answering the following questions,
you may find it convenient to add some of TCP segment fields, such as
Sequence Number and Acknowledgment Number, as columns to the Packet
List Pane. To do so, simply right-click on the desired field in the
Packet Details Pane and choose "Apply as column" from the
pop-up menu that appears. Note 2: Wireshark as default shows the sequence and acknowledgment numbers relative to the initial numbers exchanged during the TCP handshaking. Therefore, in answering questions 4, 5, and 6, look for the actual (and not the relative) numbers! (Hint: It can be found in the Preferences, under Protocols -> TCP.) |
- What are the first and last packets for the POST request?
- What is the IP address and the TCP port number used by the client computer (source) that is transferring the file to gaia.cs.umass.edu?
- What is the IP address of gaia.cs.umass.edu? On what port number is it sending and receiving TCP segments for this connection?
- What is the sequence number of the TCP SYN segment that is used to initiate the TCP connection between the client computer and gaia.cs.umass.edu? What is it in the segment that identifies the segment as a SYN segment?
- What is the sequence number of the SYNACK segment sent by gaia.cs.umass.edu to the client computer in reply to the SYN? What is the value of the ACKnowledgement field in the SYNACK segment? How did gaia.cs.umass.edu determine that value? What is it in the segment that identifies the segment as a SYNACK segment?
- What is the sequence number of the TCP segment containing the HTTP POST command?
- Consider the TCP segment containing the HTTP POST as the first segment in the TCP connection. What are the sequence numbers of the first six segments in the TCP connection (including the segment containing the HTTP POST)? At what time was each segment sent? When was the ACK for each segment received? Given the difference between when each TCP segment was sent, and when its acknowledgement was received, what is the RTT value for each of the six segments? What is the EstimatedRTT value (see Section 3.5.3, page 269 in text) after the receipt of each ACK? Assume that the value of the EstimatedRTT is equal to the measured RTT for the first segment, and then is computed using the EstimatedRTT equation on page 270 for all subsequent segments.
| Note: Wireshark has a nice feature that allows you to plot the RTT for each of the TCP segments sent. Select a TCP segment in the “listing of captured packets” window that is being sent from the client to the gaia.cs.umass.edu server. Then select: Statistics->TCP Stream Graph->Round Trip Time Graph. |
- What is the length of each of the first six TCP segments?
- What is the minimum amount of available buffer space advertised at the receiver for the entire trace? Does the lack of receiver buffer space ever throttle the sender?
- Are there any retransmitted segments in the trace file? What did you check for (in the trace) in order to answer this question?
- How much data does the receiver typically acknowledge in an ACK? Can you identify cases where the receiver is ACKing every other received segment (see Table 3.2 on page 278 in the text).
- What is the throughput (bytes transferred per unit time) for the TCP connection? Explain how you calculated this value.
TCP Congestion Control in Action
Many TCP versions have been proposed, and in practice, a wide range of these are being used on various systems. Versions such as Tahoe, Reno, NewReno and Vegas are just a few mentioned in the book. Modern machines today are typically using CUBIC TCP, and some older Microsoft machines are using an extension to Reno called Compound TCP that use a combination of losses and delay measurements to adjust the congestion window. In addition, companies such as Google are advocating for a large initial window and implementing their own transport layer solutions, such as QUIC based on UDP but with features from TCP. Other TCP versions are designed specifically for data centers, wireless environments, and for long-haul links in research networks. One method to understand how different TCP versions (implemented on different machines and OS) operate is to collect packet traces under different traffic conditions (degrees of congestion) and see how the protocols behave. In this part of the assignment you will learn about how time-sequence graphs can be used for this task.Wireshark's Time-Sequence Graph
Let’s now examine the amount of data sent per unit time from the client to the server. Rather than (tediously!) calculating this from the raw data in the Wireshark window, we’ll use one of Wireshark’s TCP graphing utilities—Time-Sequence-Graph(Stevens) —to plot out data. Select a TCP segment in the Wireshark’s “listing of captured-packets” window. Then select the menu: Statistics -> TCP Stream Graph -> Time Sequence (Stevens). You should see a plot that looks similar to the plot in Figure 2.
| Note: You will not get the graph as shown in Figure 2 if you click on the wrong packet, e.g. if you click on an acknowledgment packet instead of a TCP segment containing data. You can however easily switch direction by clicking the "Switch Direction" button. |
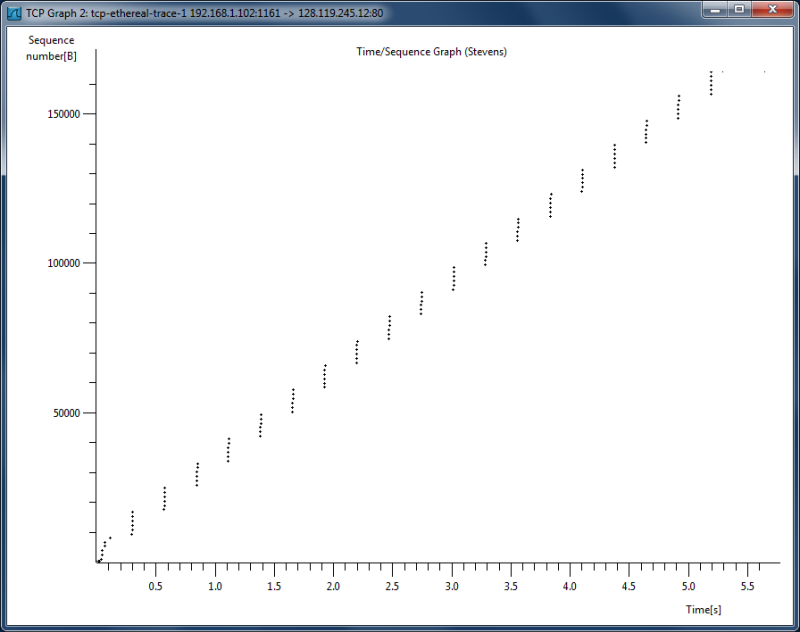 |
| Figure 2: TCP sequence number plot of the trace tcp-etheral-trace-1. |
Here, each dot represents a TCP segment sent, plotting the sequence number of the segment versus the time at which it was sent. Note that a set of dots stacked above each other represents a series of packets that were sent back-to-back by the sender. Clicking on each of the dots in the graph, selects (i.e. moves the highlight over) the corresponding segment in the Packet List Pane. You can zoom in and out, to view the graph in more detail. Use the Help button to get more information.
Answering the following questions, you might benefit from looking at other TCP Stream Graphs as well, such as Time Sequence (tcptrace), Throughput and Window Scaling. You can also get a better view of some information by adding more columns in the Packet List Pane by finding fields in the Packet Content Paneunder TCP, right-clicking them and selecting "Apply as Column".
Task B: Please answer and discuss the following three questions:
- Use the Time-Sequence-Graph (Stevens) plotting tool to view the sequence number versus time plot of segments being sent from the client to the gaia.cs.umass.edu server. Can you identify if and where TCP's slow start phase begins and ends, as well as if and where congestion avoidance takes over? Comment on ways in which the measured data differs from the idealized behavior of TCP that we've studied in the text.
- Explain the relationship between (i) the congestion window (cwnd), (ii) the receiver advertised window (rwnd), (iii) the number of unacknowledged bytes, and (iv) the effective window at the sender (i.e., the window effectively limiting the data transmission).
- Is it generally possible to find the congestion window size (cwnd) and how it changes with time, from the captured trace files? If so, please explain how. If not, please explain when and when not. Motivate your answer and give examples.
Task C: Please carefully answer and discuss questions 16-18 as outlined in this section.
In this part of the assignment, three cases will be presented to you based on some example measurements that Farrokh performed in the beginning of fall 2011. You will be asked to discuss these scenarios (and the high-level results provided) with regards to TCP fairness (see Section 3.7.1 of the text). As a hint, consider that in the textbook, the following formula is presented to estimate the steady-state throughput of a TCP connection:
where MSS is the maximum segment size, RTT is the round-trip time, and L is the loss rate. For simplicity, you can assume that the loss rate is the same for connections sharing the same bottleneck link, as well as the maximum segment size.
The first case to consider, is four concurrent downloads from the same server using four different clients (all clients are on the same host). The following table shows the total number of bytes, the duration, and the RTT associated with each of the connections:
| Connection | Total transferred bytes | Duration (in seconds) | RTT (in milliseconds) |
| 1 | 165095720 | 521 | 12 |
| 2 | 165842766 | 521 | 12 |
| 3 | 165458792 | 514 | 12 |
| 4 | 163235772 | 512 | 12 |
- What is the throughput of each of the connections in bps (bits per second)? What is the total bandwidth of the host on which the clients are running? Discuss the TCP fairness for this case.
Another case to consider is downloading the same file from different mirror servers around the world. The following table lists the details of each of the connections:
| Connection | Total transferred bytes | Duration (in seconds) | RTT (in milliseconds) |
| 1 | 261319130 | 90 | 13 |
| 2 | 175995832 | 90 | 35 |
| 3 | 151894552 | 90 | 68 |
| 4 | 140388568 | 90 | 73 |
| 5 | 108610702 | 90 | 49 |
| 6 | 70644690 | 90 | 33 |
| 7 | 65744938 | 90 | 135 |
| 8 | 43212876 | 90 | 326 |
| 9 | 39222524 | 90 | 322 |
- What is the throughput of each of the connections in bps (bits per second)? What is the total bandwidth of the host on which the clients are running? Discuss the TCP fairness for this case.
The final case to consider is a BitTorrent download from multiple peers. Similar to the previous cases, the details of each of the connections is presented in the following table. This time only ten of the connections are presented.
| Connection | Total transferred bytes | Duration (in seconds) | RTT (in milliseconds) |
| 1 | 108851134 | 58 | 40 |
| 2 | 90435681 | 58 | 36 |
| 3 | 57971584 | 53 | 100 |
| 4 | 32000012 | 29 | 68 |
| 5 | 32557334 | 35 | 31 |
| 6 | 27199361 | 31 | 33 |
| 7 | 26329578 | 31 | 122 |
| 8 | 38834490 | 56 | 146 |
| 9 | 23571761 | 35 | 74 |
| 10 | 36252962 | 55 | 66 |
- Discuss the TCP fairness for this case. How does it differ from the previous cases, and how is it affected by the use of BitTorrent?
For this assignment you will need to write a report that carefully answers each of the three tasks A (Q1-12), B (Q13-15), and C (Q16-18, as outlined above). Please structure your report such that your answers are clearly indicated for each question (and section of the assignment). It is not the TA's task to search for the answers. Both the questions themselves and the corresponding answers should be clearly stated (and indicated) in your report. Structure your report accordingly. Furthermore, your answers should be explained and supported using additional evidence, when applicable.
It is important that you demonstrate the assignment (and discuss your report) with the TA before handing in the report. Also, in addition to having a draft of the report ready, please make sure to open Wireshark and have the trace files ready before calling the TA for the demonstration.
To assess your understanding of the lab, during the demonstration, the TA may ask similar questions as those in the report. As the assignments are done in groups of two, both members of the group will be asked to answer questions. You are expected to clearly explain and motivate your answers both verbally AND in the written report.
Additional instructions and information about the reports can be found here. Please take this chance to read the guidelines carefully.