Wireshark Lab: HTTP
|
| This lab manual is based on "Wireshark Lab:
HTTP", version 2.0 (September 2009) by J.F. Kurose, K.W. Ross,
available
here.
It has been prepared by Farrokh Ghani Zadegan and Niklas Carlsson, August 2011. |
In this lab you will first need to read through
"Wireshark Lab: Getting Started". This document and the excercises in that lab will prepare your for
the lab itself. The appropriate HTTP traces can be found here (or locally).
Also, please feel free to install wireshark on your own computer and make your own traffic captures to analyze.
-
Important: To run wireshark on the lab computers you will need to "add" wireshark using the command
module initadd net/wireshark. After wireshark is added you can run it using the wireshark command.
Also, note that you cannot collect traces on the lab machines, but must instead download, open, and analyze the traces provided
by Kurose and Ross. (If you want to collect your own traces, you are encouraged to try this out on your own machine
(for which you have administrative rights).
-
Additional HTTP traces: If you want additional HTTP traces that you want to try to investigate
(and reverse engineer) what is going on,
you can also look at some of the other HTTP traces in the above zip file.
Having gotten our feet wet with the Wireshark packet
sniffer in the introductory lab above, we’re now ready to use Wireshark to investigate
protocols in operation. In this lab, we’ll explore several aspects of the HTTP
protocol: the basic GET/response interaction, HTTP message formats, retrieving
large HTML files, retrieving HTML files with embedded objects, and HTTP
authentication and security. Before beginning these labs, you might want to
review Section 2.2 of the text.
Before you start, please consider the following:
- The information that appears in brackets [ ] in Wireshark is from
Wireshark itself and NOT part of the protocols.
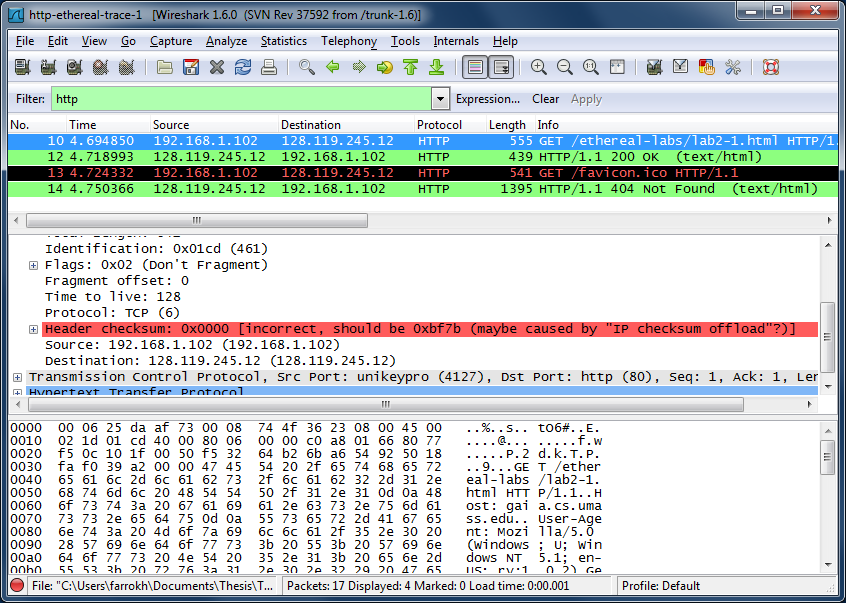
- Based on network settings of the platform on which you are running
Wireshark, you may observe that all the outbound packets are marked by
Wireshark as having checksum errors, see Figure 1. This, as suggested
by Wireshark (see the packet details pane in Figure 1), might be due to
checksum offloading, a setting which relieves CPU from generating checksum
values for outbound packets and leaves this job to be done by the network
adapter. Since Wireshark captures the packets before they reach the network
adapter, the checksum value for all the captured packets is zero.
If you find this color coding distracting or annoying, you can simply disable
the checksum error coloring rule from the View->Coloring Rules...
menu item.
1. The Basic HTTP GET/response interaction
Let’s begin our exploration of HTTP by downloading a very simple HTML file - one
that is very short, and contains no embedded objects. Do the following:
-
Start up your web browser.
-
Start up the Wireshark packet sniffer, as described in
the Introductory lab (but don’t yet begin packet capture). Enter “http”
(just the letters, not the quotation marks) in the
display-filter-specification window, so that only captured HTTP messages
will be displayed later in the packet-listing window. (We’re only interested
in the HTTP protocol here, and don’t want to see the clutter of all captured
packets).
-
Wait a bit more than one minute (we’ll see why
shortly), and then begin Wireshark packet capture.
-
Enter the following to your browser
http://gaia.cs.umass.edu/wireshark-labs/HTTP-wireshark-file1.html Your
browser should display the very simple, one-line HTML file.
-
Stop Wireshark packet capture.
Your Wireshark window should look similar to the window
shown in Figure 2. If you are unable to run Wireshark on a live network
connection, you can download a packet trace that was created when the steps
above were followed. To do so, download the zip file
http://gaia.cs.umass.edu/wireshark-labs/wireshark-traces.zip
and extract the file http-ethereal-trace-1. The traces in this zip file were
collected by Wireshark running on one of the author’s computers, while
performing the steps indicated in the Wireshark lab. Once you have downloaded
the trace, you can load it into Wireshark and view the trace using the File pull
down menu, choosing Open, and then selecting the http-ethereal-trace-1 trace
file. The resulting display should look just like Figure 2.
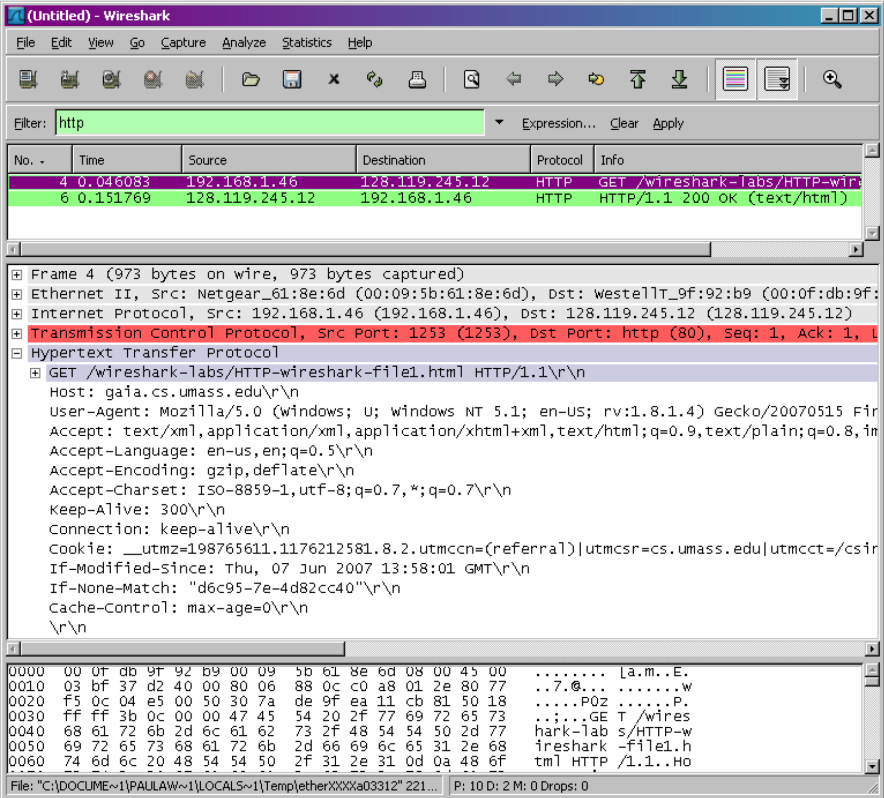
The example in Figure 2 shows in the packet-listing window that two HTTP
messages were captured: the GET message (from your browser to the
gaia.cs.umass.edu web server) and the response message from the server to your
browser. The packet-contents window shows details of the selected message (in
this case the HTTP GET message, which is highlighted in the packet-listing
window). Recall that since the HTTP message was carried inside a TCP segment,
which was carried inside an IP datagram, which was carried within an Ethernet
frame, Wireshark displays the Frame, Ethernet, IP, and TCP packet information as
well. We want to minimize the amount of non-HTTP data displayed (we’re
interested in HTTP here, and will be investigating these other protocols in
later labs), so make sure the boxes at the far left of the Frame, Ethernet, IP
and TCP information have a plus sign (which means there is hidden, undisplayed
information), and the HTTP line has a minus sign (which means that all
information about the HTTP message is displayed).
| (Note: You should ignore any HTTP GET and response for
favicon.ico. If you see a reference to this file, it is your browser
automatically asking the server if it (the server) has a small icon file
that should be displayed next to the displayed URL in your browser.
We’ll ignore references to this pesky file in this lab.). |
By looking at the information in the HTTP GET and response messages,
answer the following questions. When answering the following questions, you
should print out the GET and response messages (see the introductory Wireshark
lab for an explanation of how to do this) and indicate where in the message
you’ve found the information that answers the following questions.
- Is your browser running HTTP version 1.0 or 1.1? What version of HTTP is
the server running?
- What languages (if any) does your browser indicate that it can accept to
the server?
- What is the IP address of your computer? Of the gaia.cs.umass.edu
server?
- What is the status code returned from the server to your browser?
- When was the HTML file that you are retrieving last modified at the
server?
- How many bytes of content are being returned to your browser?
- By inspecting the raw data in the packet content window, do you see any
headers within the data that are not displayed in the packet-listing window?
If so, name one.
In your answer to question 5 above, you might have been surprised to find that
the document you just retrieved was last modified within a minute before you
downloaded the document. That’s because (for this particular file), the
gaia.cs.umass.edu server is setting the file’s last-modified time to be the
current time, and is doing so once per minute. Thus, if you wait a minute
between accesses, the file will appear to have been recently modified, and hence
your browser will download a “new” copy of the document.
2. The HTTP CONDITIONAL
GET/response interaction
Recall from Section 2.2.6 of the text, that most web
browsers perform object caching and thus perform a conditional GET when
retrieving an HTTP object. Before performing the steps below, make sure your
browser’s cache is empty. (To do this under Firefox, select Tools->Clear
Private Data, or for Internet Explorer, select Tools->Internet Options->Delete File.
These actions will remove cached files from your browser’s
cache.) Now do the following:
- Start up your web browser, and make sure your browser’s cache is cleared, as
discussed above.
- Start up the Wireshark packet sniffer
- Enter the following URL into your browser
http://gaia.cs.umass.edu/wireshark-labs/HTTP-wireshark-file2.html
Your browser should display a very simple five-line HTML file.
- Quickly enter the same URL into your browser again (or simply select the refresh
button on your browser)
- Stop Wireshark packet capture, and enter “http” in the display-filter-specification
window, so that only captured HTTP messages will be displayed later in the
packet-listing window.
- (Note: If you are unable to run Wireshark on a live network connection, you can
use the http-ethereal-trace-2 packet trace to answer the questions below; see
here.
This trace file was gathered while performing the steps above on one
of the author’s computers.)
Answer the following questions:
- Inspect the contents of the first HTTP GET request from your browser to the
server. Do you see an “IF-MODIFIED-SINCE” line in the HTTP GET?
- Inspect the contents of the server response. Did the server explicitly return the
contents of the file? How can you tell?
- Now inspect the contents of the second HTTP GET request from your browser to
the server. Do you see an “IF-MODIFIED-SINCE:” line in the HTTP GET? If
so, what information follows the “IF-MODIFIED-SINCE:” header?
- What is the HTTP status code and phrase returned from the server in response to
this second HTTP GET? Did the server explicitly return the contents of the file?
Explain.
3. Retrieving Long Documents
In our examples thus far, the documents retrieved have been simple and short HTML
files. Let’s next see what happens when we download a long HTML file. Do the
following:
- Start up your web browser, and make sure your browser’s cache is cleared, as
discussed above.
- Start up the Wireshark packet sniffer
- Enter the following URL into your browser
http://gaia.cs.umass.edu/wireshark-labs/HTTP-wireshark-file3.html
Your browser should display the rather lengthy US Bill of Rights.
- Stop Wireshark packet capture, and enter “http” in the display-filter-specification
window, so that only captured HTTP messages will be displayed.
- (Note: If you are unable to run Wireshark on a live network connection, you can
use the http-ethereal-trace-3 packet trace to answer the questions below;
here.
This trace file was gathered while performing the steps above on one
of the author’s computers.)
In the packet-listing window, you should see your HTTP GET message, followed by a
multiple-packet response to your HTTP GET request. This multiple-packet response
deserves a bit of explanation. Recall from Section 2.2 (see Figure 2.9 in the text) that the
HTTP response message consists of a status line, followed by header lines, followed by a
blank line, followed by the entity body. In the case of our HTTP GET, the entity body in
the response is the entire requested HTML file. In our case here, the HTML file is rather
long, and at 4500 bytes is too large to fit in one TCP packet. The single HTTP response
message is thus broken into several pieces by TCP, with each piece being contained
within a separate TCP segment (see Figure 1.24 in the text).
Each TCP segment is recorded as a separate packet by
Wireshark, and the fact that the single HTTP response was fragmented across
multiple TCP packets is indicated by the
“TCP segment of a reassembled PDU” phrase
displayed by Wireshark. We stress here that there is no “TCP segment of a reassembled PDU” message in
HTTP!
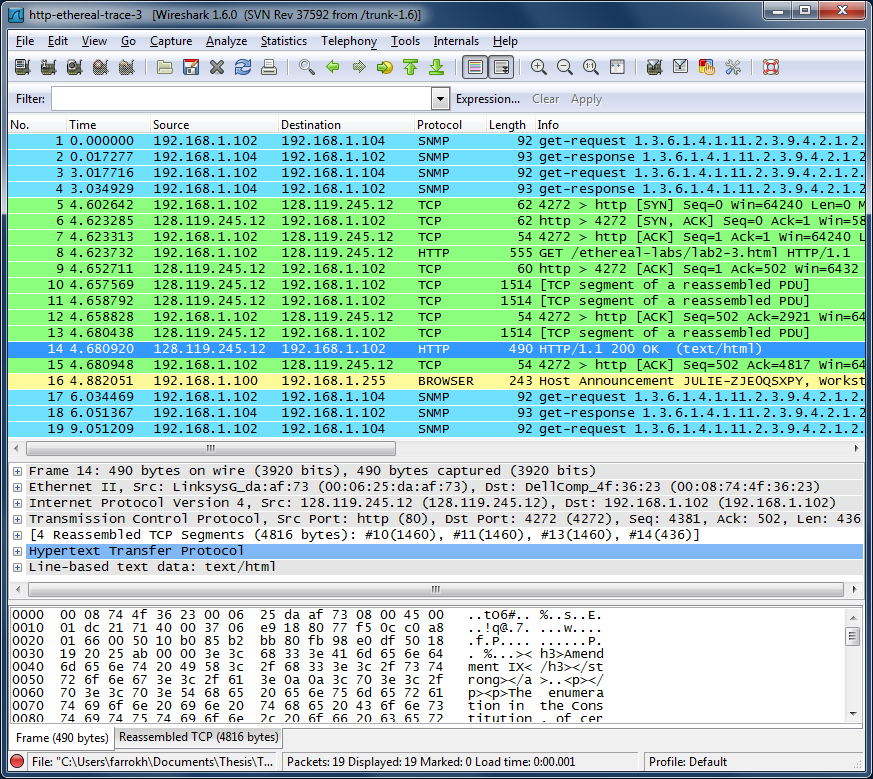
In this regard, Figure 3 shows a screenshot of Wireshark displaying http-ethereal-trace-3 packet trace.
In the listing of the captured packets, packet No. 8 shows the HTTP GET request and packet No. 14
shows the corresponding HTTP response. It can be seen that the packets No. 10, 11 and 13 are labeled
with “TCP segment of a reassembled PDU”. By clicking on the HTTP response, i.e. packet No. 14, the packet
details pane shows [4 Reassembled TCP
Segments (4816 bytes): #10(1460), #11(1460), #13(1460), #14(436)] (see Figure 3). Additionally, the packet bytes pane
shows a new tab titled Reassembled TCP
which shows the entire received HTTP response.
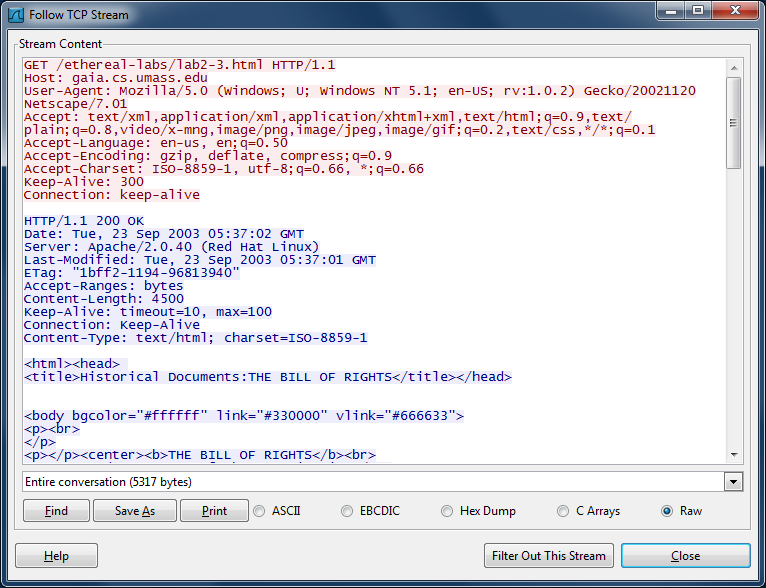
A more convenient way to view the entire data (i.e. all HTTP requests and responses
transported in a TCP stream) is using a Wireshark feature called "Following TCP Streams".
By right-clicking on any of the TCP packets associated with a given TCP stream and
selecting the "Follow TCP Stream" menu item, a new window pops up that contains the
data exchanged in the selected stream. Figure 4, shows the "Follow TCP Stream" window
for the
GET /ethereal-labs/lab2-3.html HTTP/1.1
request and its complete associated response. In this window, the non-printable
characters are replaced by dots. However, the choice of Raw or ASCII in this window,
affects the way you can save the entire stream. That is, if Raw is selected, the
stream is saved as a binary file preserving the non-printable characters,
whereas in the case of ASCII, the stream is saved as a text file in which the
non-printable characters are replaced by dots. Please note how Wireshark has
changed (and applied) the display
filter to show only the packets in the selected stream.
Answer the following questions:
- How many HTTP GET request messages were sent by your browser?
- How many data-containing TCP segments were needed to carry the single HTTP
response?
- What is the status code and phrase associated with the response to the HTTP GET
request?
- Are there any HTTP status lines in the transmitted data associated with TCP segmentation?
4. HTML Documents with Embedded Objects
Now that we’ve seen how Wireshark displays the captured packet traffic for large HTML
files, we can look at what happens when your browser downloads a file with embedded
objects, i.e., a file that includes other objects (in the example below, image files) that are
stored on another server(s).
Do the following:
- Start up your web browser, and make sure your browser’s cache is cleared, as
discussed above.
- Start up the Wireshark packet sniffer
- Enter the following URL into your browser
http://gaia.cs.umass.edu/wireshark-labs/HTTP-wireshark-file4.html
Your browser should display a short HTML file with two images. These two
images are referenced in the base HTML file. That is, the images themselves are
not contained in the HTML; instead the URLs for the images are contained in the
downloaded HTML file. As discussed in the textbook, your browser will have to
retrieve these logos from the indicated web sites. Our publisher’s logo is
retrieved from the www.aw-bc.com web site. The image of our book’s cover is
stored at the manic.cs.umass.edu server.
- Stop Wireshark packet capture, and enter “http” in the display-filter-specification
window, so that only captured HTTP messages will be displayed.
- (Note: If you are unable to run Wireshark on a live network connection, you can
use the http-ethereal-trace-4 packet trace to answer the questions below; see
here.
This trace file was gathered while performing the steps above on one
of the author’s computers.)
Answer the following questions:
- How many HTTP GET request messages were sent by your browser? To which
Internet addresses were these GET requests sent?
- Can you tell whether your browser downloaded the two images serially, or
whether they were downloaded from the two web sites in parallel? Explain.
5. HTTP Authentication
Finally, let’s try visiting a web site that is password-protected and examine the sequence
of HTTP message exchanged for such a site. The URL
http://gaia.cs.umass.edu/wireshark-labs/protected_pages/HTTP-wireshark-file5.html is
password protected. The username is “wireshark-students” (without the quotes), and the
password is “network” (again, without the quotes). So let’s access this “secure”
password-protected site. Do the following:
- Make sure your browser’s cache is cleared, as discussed above, and close down
your browser. Then, start up your browser
- Start up the Wireshark packet sniffer
- Enter the following URL into your browser
http://gaia.cs.umass.edu/wireshark-labs/protected_pages/HTTP-wireshark-file5.html
Type the requested user name and password into the pop up box.
- Stop Wireshark packet capture, and enter “http” in the display-filter-specification
window, so that only captured HTTP messages will be displayed later in the
packet-listing window.
- (Note: If you are unable to run Wireshark on a live network connection, you can
use the http-ethereal-trace-5 packet trace to answer the questions below; see
here.
This trace file was gathered while performing the steps above on one
of the author’s computers.)
Now let’s examine the Wireshark output. You might want to first read up on HTTP
authentication by reviewing the easy-to-read material on “HTTP Access Authentication
Framework” at
http://frontier.userland.com/stories/storyReader$2159
Answer the following questions:
- What is the server’s response (status code and phrase) in response to the initial
HTTP GET message from your browser?
- When your browser’s sends the HTTP GET message for the second time, what
new field is included in the HTTP GET message?
The username (wirehsark-students) and password (network) that you entered are encoded
in the string of characters (d2lyZXNoYXJrLXN0dWRlbnRzOm5ldHdvcms=) following
the “Authorization: Basic” header in the client’s HTTP GET message. While it
may appear that your username and password are encrypted, they are simply encoded in a
format known as Base64 format. The username and password are not encrypted! To see
this, go to
http://gtools.org/tool/base64-encode-decode/ and enter the base64-encoded
string d2lyZXNoYXJrLXN0dWRlbnRz into the "Decode from base64" text box and
press "Go". Voila! You have translated
from Base64 encoding to ASCII encoding, and thus should see your username! To view
the password, enter the remainder of the string Om5ldHdvcms= and press decode. Since
anyone can download a tool like Wireshark and sniff packets (not just their own) passing
by their network adaptor, and anyone can translate from Base64 to ASCII (you just did
it!), it should be clear to you that simple passwords on WWW sites are not secure unless
additional measures are taken.
Fear not! As we will see in Chapter 7, there are ways to make WWW access more secure.
However, we’ll clearly need something that goes beyond the basic HTTP authentication
framework!
Demonstration and Report
For this assignment you will need to write a report that
carefully answers each of the above questions. Please
structure your report such that your answers are clearly
indicated for each question (and section of the assignment).
It is not the TA's task to search for the answers. Both the
questions themselves and the corresponding answers should be
clearly stated (and indicated) in your report. Structure your
report accordingly. Furthermore, your answers should be explained
and supported using additional evidence, when applicable. During
the demonstration the TA may ask similar questions to assess your
understanding of the lab. You are expected to clearly explain and
motivate your answers. As the assignments are done in groups of two,
both members of the group will be asked to answer questions.
Additional instructions and information about the reports can be found
here.
Please take this chance to read the guidelines carefully.
A Note on Wireshark Protocol Dissectors
Note: You may find the following hint useful, specially when you use Wireshark to sniff data
that is being exchanged between browser and the proxy server you will develop for Lab 2.
Wireshark uses protocol dissectors to extract information from packets. For
example, the information shown under the "Hypertext Transfer Protocol" node
in the packet details pane in Figure 2 are extracted using the HTTP protocol
dissector. Wireshark, however, is not always able to choose the right
dissector for a packet. This happens for example, when an uncommon port is used for a
common protocol, making Wireshark not able to choose the right type of
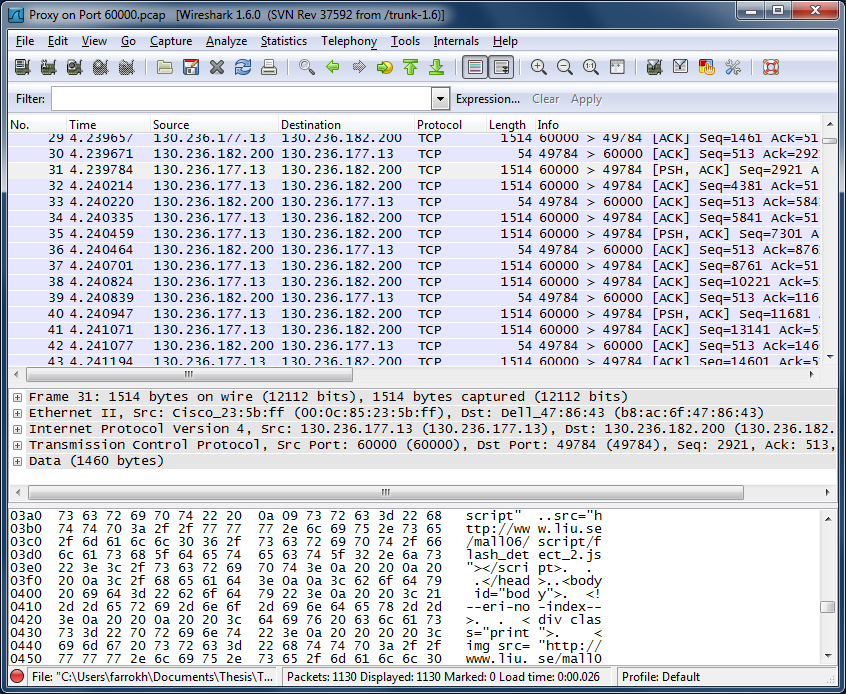
dissector. Such an example is shown in Figure 5 where a proxy server on port
60000 is used to access web pages. It can be seen from Figure 5 that although
the contents of the packets are HTTP data, the protocol is not detected as HTTP.
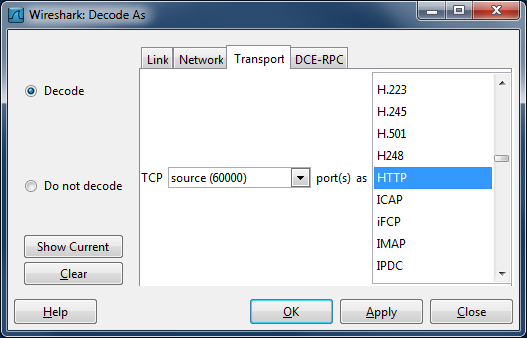
Fortunately, it is possible to instruct Wireshark what dissector to use for a given
packet. By right-clicking on a packet and selecting "Decode As ...", a window
opens which allows assigning the desired protocol dissector to the selected packet,
see Figure 6. In the example of Figure 6, after selecting the Transport tab, one
can select the HTTP protocol dissector to be used for every packet with the source
port of 60000. In the same manner, one can right-click on a packet with the
destination port of 60000 and assign the HTTP dissector to it, so that both
outbound and inbound packets to and from the proxy server are decoded as HTTP.
Please note that such user specified decodes cannot be saved and are lost upon
exiting Wireshark.