Paper at
IEEE European Test Symposium (ETS'05)
Tallinn, Estonia - May 2005 (PR-MS 24.626)
Test Scheduling for Modular SOCs
in an Abort-on-Fail Environment
|
Urban Ingelsson²
|
Sandeep Kumar Goel¹
|
Erik Larsson²
|
Erik Jan Marinissen¹
|
Abstract
Complex SOCs are increasingly tested in a modular fashion, which enables us to record the yield-per-module. In this
paper, we consider the yield-per-module as the pass probability of the module's manufacturing test. We use it to exploit
the abort-on-fail feature of ATEs, in order to reduce the expected test application time. We present a model for expected test time, which obtains increasing accuracy due to decreasing granularity of the abortable test unit. For a given SOC, with a modular test architecture consisting of wrappers and disjunct TAMs, and for given pass probabilities per module test, we schedule
We describe
two heuristic scheduling approaches, one without and one with preemption. Experimental results for the ITC'02 SOC
Test Benchmarks demonstrate the effectiveness of our approach, as we achieve up to 97% reduction in the expected test
application, without any modification to the SOC or ATE.
1 Introduction
Rapid improvements in semiconductor design and manufacturing
technologies enable the creation of increasingly complex integrated
circuits, often refered to as system chips or SOCs. The
manufacturing test costs of these 'monster chips' threaten to increase
beyond what is acceptable, if no proper countermeasures
are taken. The test costs are dictated by the price of the automatic
test equipment (ATE) and the time (in seconds) each SOC spends
on the ATE. A reduction of the test application time directly contributes
to savings in the test cost.
SOCs are increasingly designed and tested in a modular fashion.
A modular test is required for non-logic embedded blocks (such
as embedded memories, analog modules, embedded FPGAs, etc.)
and black-boxed third-party IP cores. But also for the remainder
of the SOC, modular testing has attractive benefits, in terms
of 'divide-n-conquer' test generation and test re-use over multiple
SOC designs [1]. A modular test requires an on-chip test infrastructure
[2, 3] in the form of a wrapper per module (such as the one
standardized by IEEE P1500 [4, 5]) and test access mechanisms
(TAMs).
A modular test makes it possible to record the yield-per-module.
This information is valuable to core providers, who can improve
their product with this information, but who often had no access to
statistically relevant yield numbers, as they typically do not manufacture
their own products in high volumes. The yield-per-module
is also relevant for SOC integrators, who will be able to better predict
the yields of their next SOC product, based on historic yield
data of the constituting modules.
In this paper, we consider the yield-per-module as the pass probability
of a module's manufacturing test. We use it to exploit the
abort-on-fail capability of ATEs, in order to reduce the expected
test application time. For a given SOC, with a modular test architecture
consisting of wrappers and disjunct TAMs, and for given
pass probabilities per module test, we schedule the tests on each
TAM such that the overall expected test application time is minimized.
The remainder of this paper is organized as follows. Section 2 reviews
the prior work in this field. Section 3 presents our formal
problem definition. In Section 4, we present a model for expected
test application time, which obtains increasing accuracy due to decreasing
granularity of the abortable test unit. Subsequently, Section
5 describes our heuristic scheduling algorithms without and
with preemption. In Section 6, experimental results are given for SOC p22810
of the ITC'02 SOC Test Benchmarks [6]. They demonstrate the
effectiveness of our approach, as we achieve up to 97% reduction
of the expected test application time, without any modification to
the SOC itself. Section 7 concludes this paper.
2 Prior Work
The idea to use pass probabilities, yield, or fault coverage of tests
of (parts of) an IC to construct a schedule such that the expected
test application time is minimized is not new. Lee
& Krishna [7, 8] partitioned a single test in multiple abortable
units of equal pass probability. As tests are typically more likely
to fail in their early patterns, their test units are ordered from small
in the beginning of the test to large at the end. Huss & Gyurcsik
[9] presented a scheduling approach for a series of analog tests
with partly overlapping test coverage. Jiang & Vinnakota [10, 11]
described an efficient heuristic algorithm for the same problem. In
[9, 10, 11], analog tests can only be evaluated upon completion.
In the sequel of this paper, we argue that that is not necessary for
digital tests. Evaluating (and, in case of failure, aborting) tests at
a smaller grain size can help to significantly reduce the expected
test application time.
All papers mentioned above did not consider modularly-tested (core-based) SOCs, in which multiple TAMs can operate independtly and in parallel; in fact, only few other papers do. Koranne [12] proposed a technique
for test architecture (wrapper and TAM) design, in combination
with test scheduling. He used average time instead of completion
time of the test schedule as a heuristic to reduce an originally
 -hard and hence intractable problem [13] to a problem that
can be solved optimally in polynomial time. Unfortunately, the
paper lacks the concept of pass probability altogether. The only
paper, to the best of our knowledge, that comes relatively close to
our work is a paper by Larsson et al. [14]. For a modularly-tested
SOC with given pass probabilities per module test, it optimizes the
test architecture, such that the corresponding expected test time is
minimized. Differences between [14] and our paper are the following.
We assume a given test architecture with disjunct TAMs,
whereas Larsson et al. design test architectures in which TAMs
are allowed to fork-n-merge. For simplicity, Larsson et al. consider
only entire module tests as abortable units, whereas we also
allow for smaller granularities, in order to improve the accuracy
of the expected test application time calculation. The two papers
present different scheduling algorithms, while we also consider
the case in which preemption of tests is allowed.
-hard and hence intractable problem [13] to a problem that
can be solved optimally in polynomial time. Unfortunately, the
paper lacks the concept of pass probability altogether. The only
paper, to the best of our knowledge, that comes relatively close to
our work is a paper by Larsson et al. [14]. For a modularly-tested
SOC with given pass probabilities per module test, it optimizes the
test architecture, such that the corresponding expected test time is
minimized. Differences between [14] and our paper are the following.
We assume a given test architecture with disjunct TAMs,
whereas Larsson et al. design test architectures in which TAMs
are allowed to fork-n-merge. For simplicity, Larsson et al. consider
only entire module tests as abortable units, whereas we also
allow for smaller granularities, in order to improve the accuracy
of the expected test application time calculation. The two papers
present different scheduling algorithms, while we also consider
the case in which preemption of tests is allowed.
3 Problem Definition
In this paper, a test architecture [3] is defined as a non-empty set
of modules  , a non-empty set of TAMs
  , and an assigned-modules
function
, and an assigned-modules
function 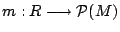 , in which
  denotes the
subset of modules assigned to TAM
denotes the
subset of modules assigned to TAM  , such that
|
|
1.  , ,
i.e., all modules are assigned to a TAM, and
2.  , ,
i.e., each module is assigned to at most one TAM.
|
For a given test architecture, a feasible schedule is a schedule in which tests of modules assigned to the same TAM are executed in series, whereas the sets of modules
assigned to disjunct TAMs are tested in parallel. While in a test architecture the modules assigned to the same TAM form an (unordered) set , in a corresponding feasible schedule these modules for an (ordered) list. For this we introduce a function  , specified
by
, specified
by  ;
;  denotes that the test of
module
denotes that the test of
module  is ordered as item number
  on TAM .
A test architecture has  corresponding non-delay¹
feasible schedules. In our problem at hand, we try to identify a
corresponding non-delay feasible schedule which gives the minimal
expected test application time.
corresponding non-delay¹
feasible schedules. In our problem at hand, we try to identify a
corresponding non-delay feasible schedule which gives the minimal
expected test application time.
Problem [Scheduling for Minimal Expected Test Time (SMETT)]
For an SOC is given a set of modules , and, for the test of each
module  , a number of test patterns
  and a pass probability
 . Also given is a test architecture with a set of TAMs ,
and for each TAM
. Also given is a test architecture with a set of TAMs ,
and for each TAM  its width
  and a modules-assigned
function . Finally, also given are the scan-in length
and a modules-assigned
function . Finally, also given are the scan-in length  and scan-out length
  for each module in this test
architecture. Determine a corresponding feasible schedule, i.e.,
determine an ordered list corresponding to for each TAM
, such that the overall expected test time
for each module in this test
architecture. Determine a corresponding feasible schedule, i.e.,
determine an ordered list corresponding to for each TAM
, such that the overall expected test time  of the SOC is
minimized.
of the SOC is
minimized. ![[]](img25.png)
For simplicity, we assume in this paper that every module has only one test.
However, our theory and results can easily be extended to cover
the case in which modules have multiple tests.
The scan-in and scan-out lengths and in the above
problem definition follow from (1) the test data of module [6],
(2) the width of the TAM to which is assigned, and (3)
the wrapper design algorithm used. For the latter, we have used
the COMBINE algorithm [16]. Note that the problem discussed in
this paper is also applicable to non-scan-testable modules; in those
cases, the contribution of the internal scan chains to the scan-in
and scan-out lengths is simply zero.
The pass probability of a test equals the yield of the corresponding
module. To obtain these pass probabilities, one possible scenario
is to first test a sufficient number of SOCs without abort-on-fail,
just to record the yield-per-module. This could, for example, be
done with a schedule that minimizes the overall test completion
time [13, 2, 3, 12]. Once statistically relevant yields-per-module have been recorded,
a new schedule is created that exploits the pass probabilities per
test to minimize the expected test time (Problem SMETT) and applied
with the ATE's abort-on-fail feature 'on' [10, 11]. An alternative
scenario is to right-away start testing with the abort-on-fail
feature, while initially using as pass probabilities estimates based
on module type and size and experience obtained from previous
SOCs. In both scenarios, it is possible to collect further yield-per-module
data, even when the abort-on-fail feature is turned 'on'.
In this way, we can record changes in pass
probabilities (e.g., due to changing manufacturing conditions) and adjust the test schedule accordingly.
4 Model for Expected Test Time
To solve Problem SMETT, calculation of the expected test time is required. In this section, we discuss the basics of expected test time
calculation for a schedule of a test architecture with multiple disjunct
TAMs, improvements in accuracy obtained by reducing the size of the
abortable units, and the related distribution of given pass probabilities.
4.1 Basic Expected Test Time Calculation
The test of module has pass probability ; furthermore,
we assume that the test time of this test is  .
.
First consider the case of only one TAM . The set of modules to
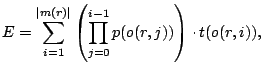
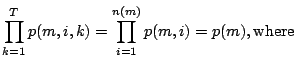
be tested is . Under the assumption that test execution can only be aborted once an individual module test has completed, Huss & Gyurcsik [9] showed that the expected test time can be expressed by
|
|
(4.1)
|
where  .
.
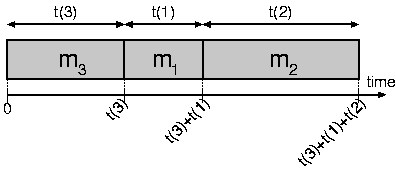
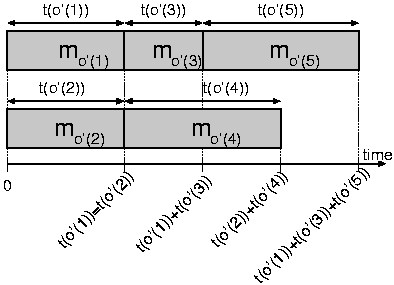
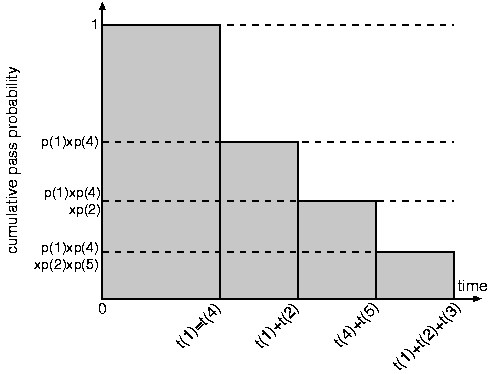
Figure 1 shows an illustrative example consisting of one TAM
with three modules. Figure 1(a) shows the original schedule:
 . Based on this order, order function is defined:
  ,
,  , and
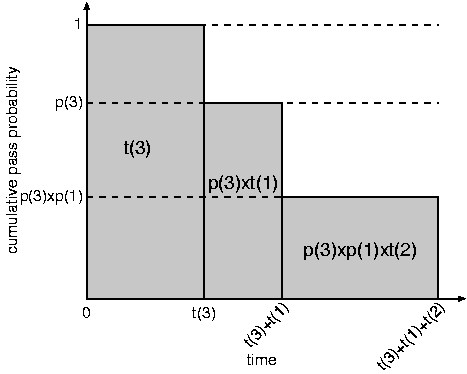
, and  . The same schedule, now with is depicted in Figure 1(b). Figure 1(c) shows
the cumulative pass probability as a function of time. The test
of
. The same schedule, now with is depicted in Figure 1(b). Figure 1(c) shows
the cumulative pass probability as a function of time. The test
of  is executed with probability 1, as it is the first test in the
schedule. Only if passes its test, the test of
is executed with probability 1, as it is the first test in the
schedule. Only if passes its test, the test of  will be executed. Hence, the expected test time after the second test is
 .
Similarly, the test of
.
Similarly, the test of  will only be executed if the first two tests
both pass, i.e., with probability
will only be executed if the first two tests
both pass, i.e., with probability  . Consequently, the total expected test time is
 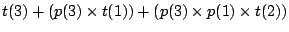 .
Note that the expected test time equals the shaded area under the
cumulative pass probability curve in Figure 1(c).
.
Note that the expected test time equals the shaded area under the
cumulative pass probability curve in Figure 1(c).
(a)
(b)
(c)
|
Figure 1: A schedule for three modules on one TAM with (a) original and (b) ordered module names, and (c) the
corresponding cumulative pass-probability curve.
|
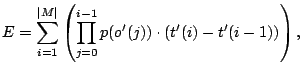
Next, we consider the case of a full-fledged test architecture, consisting of multiple parallel TAMs. Larsson et al. [14] described
how to extend the expected test time expression of Equation 4.1 to
cover multiple TAMs. Every completion of an individual test provides an opportunity to abort the test. The test completion times of
the tests on the individual TAMs in a given test schedule determine
a complete global ordering of all tests. This ordering is expressed
by a function  ;
; denotes that the test of
module is the th test to complete in the global schedule. Now,
the total expected test time for the entire test schedule can be
expressed by
denotes that the test of
module is the th test to complete in the global schedule. Now,
the total expected test time for the entire test schedule can be
expressed by
|
|
(4.2)
|
where  ,
,  , and
, and 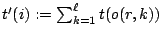 in which and
  are defined such that
 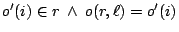 .
.
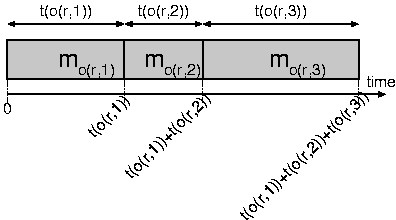
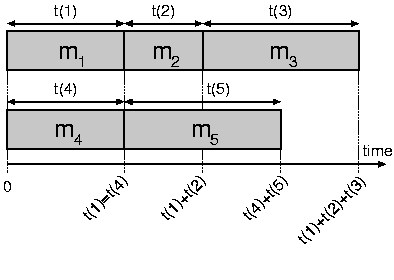
Figure 2 shows an illustrative example consisting of two TAMs
with resp. three and two modules. Figure 2(a) shows the original schedule. The order of completion of the various tests has
the following sequence: 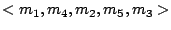 . (Actually, the tests of modules and
  complete simultaneously,
and hence and could just as well have been swapped
in this sequence.) Based on this order, function
complete simultaneously,
and hence and could just as well have been swapped
in this sequence.) Based on this order, function  is defined:
 , and
, and  .
This renaming is depicted in Figure 2(b). Figure 2(c) shows the
corresponding cumulative pass probability as a function of time.
.
This renaming is depicted in Figure 2(b). Figure 2(c) shows the
corresponding cumulative pass probability as a function of time.
(a)
(b)
(c)
|
Figure 2: A schedule for two TAMs with resp. three and two modules
with (a) original and (b) ordered module names, and (c) the corresponding cumulative pass-probability curve.
|
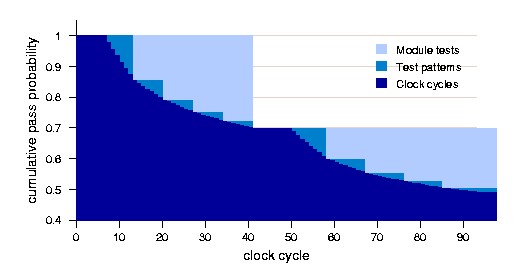
4.2 Reducing the Abortable Unit Size
The expected test time is reduced if we reduce the size of the
abortable units. Three natural abortable units are (1) module
tests, (2) test patterns, and (3) clock cycles. Figure 3 illustrates this
by showing the cumulative pass probability as a function of time
for the three mentioned abortable unit sizes; increasing darker colors represent decreasing unit sizes. In this small example, the entire test
suite consists of two module tests, each consisting of five test patterns, which in turn consist of multiple clock cycles. As discussed
in Section 4.1, the expected test time equals the shaded area under the curve. As the darker curves lie strictly below the lighter
curves, the corresponding expected test time is smaller.
|
Figure 3: Cumulative pass probability as a function of time for three
abortable unit sizes: module tests, test patterns, and clock cycles.
|
Most ATEs can abort a digital test almost immediately; only really fast ATEs have a (negligible) small number of clock cycles pipeline
delay between the occurrence of the failing response bit at the
SOC pins and the actual stop of the test execution. Hence, it is fair
to state that reducing the abortable unit size not only decreases
the calculated expected test time , but also makes more accurate.
The smallest and most accurate expected test time is calculated
in a model which assumes the abortable unit to be a single clock
cycle.
From Figure 3 we can also learn that the relative improvement in
size and accuracy of the expected test time calculated decreases
for increasingly small unit sizes. In other words: the biggest gain
is obtained in going from tests to patterns, while the additional
gain from going from patterns to cycles is relatively small.
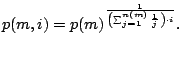
4.3 Pass Probability Distribution
Using more and smaller abortable units to calculate the expected
test time requires pass probabilities for these units. In the definition
of Problem SMETT, only one pass probability per module test is
given. As we do not want to burden the user by providing us with
more pass probabilities, we calculate those ourselves, by means
of 'distributing' the pass probability of the module test over the
smaller units.
We first consider the distribution of the pass probability of
the test of module over the pass probabilities  of the
individual test patterns of . This distribution has to be
such that
of the
individual test patterns of . This distribution has to be
such that 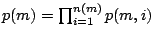 . One way to do this is to assume
a flat distribution, in which
. One way to do this is to assume
a flat distribution, in which 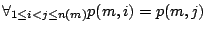 .
Such a flat distribution is achieved by
.
Such a flat distribution is achieved by 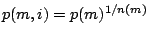 .
However, a more realistic distribution of pass probabilities is one
in which the early patterns are much more likely to fail than late
test patterns. We refer to such a distribution as curved, and it is
characterized by
.
However, a more realistic distribution of pass probabilities is one
in which the early patterns are much more likely to fail than late
test patterns. We refer to such a distribution as curved, and it is
characterized by
|
|
(4.3)
|
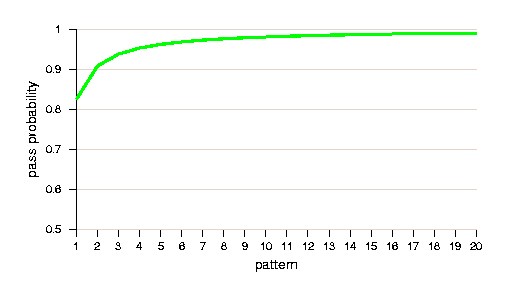
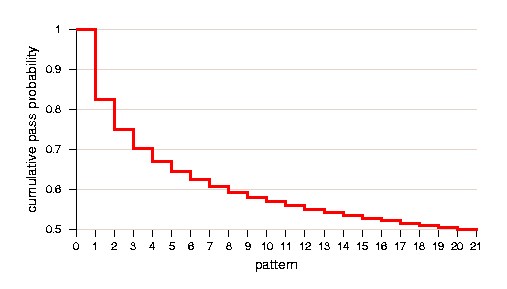
Figure 4 shows for an example module with  and
and
 both the pass probability and the cumulative
pass probability
both the pass probability and the cumulative
pass probability  per pattern , based on a curved
distribution. The figure illustrates that by using Equation (4.3),
the pass probability is at first a steeply increasing function, which
soon flattens out to almost horizontal, but still increasing. This
curve follows the shape of the familiar (cumulative incremental)
fault coverage curves.
per pattern , based on a curved
distribution. The figure illustrates that by using Equation (4.3),
the pass probability is at first a steeply increasing function, which
soon flattens out to almost horizontal, but still increasing. This
curve follows the shape of the familiar (cumulative incremental)
fault coverage curves.
(a)
(b)
|
Figure 4: Example of (a) pass probability and (b) cumulative pass probability per pattern.
|
Secondly, we consider the distribution of the pass probability
of an individual test pattern over the pass probabilities
 of its constituting clock cycles
  . During 'scan-in-only'
clock cycles, no test responses are evaluated and thus the test cannot fail; hence, we set the corresponding pass probability to 1.
Scan-in-only cycles occur (1) during scan-in of the first test pattern,
and, for other patterns, (2) only if scan-in is longer than scan-out. In the latter, we assume that scan-out of a pattern takes place concurrently
with scan-in of the next pattern, there are
. During 'scan-in-only'
clock cycles, no test responses are evaluated and thus the test cannot fail; hence, we set the corresponding pass probability to 1.
Scan-in-only cycles occur (1) during scan-in of the first test pattern,
and, for other patterns, (2) only if scan-in is longer than scan-out. In the latter, we assume that scan-out of a pattern takes place concurrently
with scan-in of the next pattern, there are 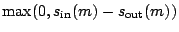 scan-in-only cycles per test pattern. During the remaining
  clock cycles per test pattern, test responses are evaluated and consequently the test can fail; hence, we distribute the pass probability
of the test pattern over these cycles only. We assume that
within one test pattern, all non-'scan-in-only' clock cycles have an
equal pass probability. Then, the pass probability for a non-'scan-
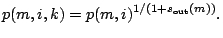
in-only' clock cycle of pattern of module is given by
clock cycles per test pattern, test responses are evaluated and consequently the test can fail; hence, we distribute the pass probability
of the test pattern over these cycles only. We assume that
within one test pattern, all non-'scan-in-only' clock cycles have an
equal pass probability. Then, the pass probability for a non-'scan-
in-only' clock cycle of pattern of module is given by
|
|
(4.4)
|
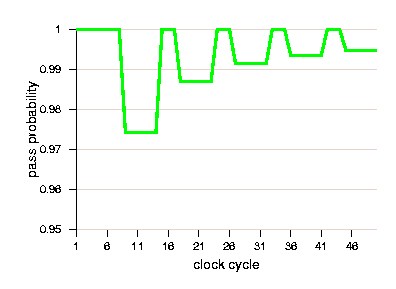
Figure 5 illustrates the above for an example module , with
 ,
,  ,
, . Note
that this example is chosen such that
. Note
that this example is chosen such that  , and hence 'scan-
in-only' cycles occur in every pattern. Figure 5(a) shows the pass
probability per clock cycle. This pass probability is 1 for all 'scan-
in-only' cycles. In all other clock cycles, the pass probabilities
are such that (1) the curve between patterns is increasing (per Equation (4.3)), (2) the curve within one pattern is flat (per
Equation (4.4)), and (3) the products of all pass probabilities per individual unit amount to , i.e.,
, and hence 'scan-
in-only' cycles occur in every pattern. Figure 5(a) shows the pass
probability per clock cycle. This pass probability is 1 for all 'scan-
in-only' cycles. In all other clock cycles, the pass probabilities
are such that (1) the curve between patterns is increasing (per Equation (4.3)), (2) the curve within one pattern is flat (per
Equation (4.4)), and (3) the products of all pass probabilities per individual unit amount to , i.e.,
|
|
(4.5)
|
 .
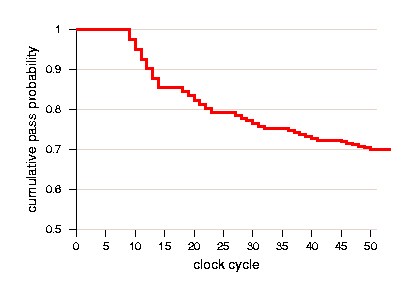
Figure 5(b) shows the corresponding cumulative pass probability
per clock cycle.
.
Figure 5(b) shows the corresponding cumulative pass probability
per clock cycle.
(a)
(b)
|
Figure 5: Example with (a) pass probability and (b) cumulative pass
probability per clock cycle.
|
5 Scheduling Algorithm
5.1 Non-Preemptive Scheduling
As mentioned in Section 3, a given test architecture has
corresponding non-delay feasible schedules.
Real-life test architectures typically have at least one TAM containing a large number of modules, and for these architectures, an
exhaustive search over all schedules is impractical. We have
implemented an efficient heuristic scheduling algorithms to address
this problem.
Our overall approach is to optimize the schedule per TAM, as it is
computationally straight forward, and yet results in good overall schedules.
The scheduling per TAM is done such that tests that are likely to
fail as well as short tests are candidates to be scheduled early.
In non-preemptive scheduling, the module tests are considered
as atomic scheduling units. We assign each module a weight
 , and simply sort the modules in increasing weight. Weight
is defined by
, and simply sort the modules in increasing weight. Weight
is defined by
|
|
(5.1)
|
In the case of only one TAM, this scheduling algorithm gives optimal results (proof omitted due to lack of space). For the other cases, we have counter-examples that prove that results are not guaranteed to be optimal, although the algorithm turns out to be an effective heurisitc approach.
The compute time for our scheduling algorithm is dominated by
the time spent on sorting, viz.  per TAM .
5.2 Preemptive Scheduling
It is well known that for logic tests, most faults are detected already
in the first few test patterns. The remaining test patterns
have a decreasing incremental fault coverage and are typically targeted
towards the small fraction of 'hard-to-detect' faults. Exactly
this property we tried to model in the pass probability distribution
from tests to patterns in Section 4.3. Given this behavior, allowing
preemption of tests is attractive. A first part of a test can be short
and still have a low pass probability, and hence, when scheduled
early, reduces the expected test time. The remaining part(s) of the
test will have a higher pass probability and can be scheduled later.
Preemption typically reduces the expected test time drastically. However, in some cases preemption also increases the test completion time slightly.
In our approach, we assumed overlapped scan-out of one pattern
with scan-in of the next pattern for patterns of the same test, but
not for test patterns of different tests. Hence, for each preemptive cut of the test of a module , the test completion time of TAM (with  ) increases with
  . If happens to be the TAM with dominant test time, the overall test completion time is increased due to the preemption. A (slightly) larger test completion time implies that we need a (slightly) increased ATE vector memory to store the test patterns.
In this paper, we consider a straight-forward preemption strategy, consisting
of two steps. In Step 1, we divide every module test into two
parts. The first part consists of 10% of the total number of test
patterns for the module, while the other part consists of the remaining
90% of the test patterns. We assign them pass probabilities
according to the approach of Equation (4.3). In Step 2, both
parts are treated as two separate tests and scheduled with our non-preemptive
scheduling algorithm, described in Section 5.1.
6 Experimental Results
We obtained experimental results for the ITC'02 Test Benchmarks
[6]. As the original benchmark data does not contain pass probabilities, we have added these ourselves. We have used two different
sets of pass probabilities. The first set is taken from [14];
we refer to it as the  set. The second set we have constructed
ourselves; this so-called
set. The second set we have constructed
ourselves; this so-called  set takes into account the type of the
module (logic or memory) and its relative size. The pass probabilities
vary, for the set from 90% to 99%, and for the set from
23% to 99%; the full details can be found at [17]. Test architectures, which form the starting point of
our problem definition, were generated by TR-ARCHITECT [3]
for a given SOC and given maximal TAM width
set takes into account the type of the
module (logic or memory) and its relative size. The pass probabilities
vary, for the set from 90% to 99%, and for the set from
23% to 99%; the full details can be found at [17]. Test architectures, which form the starting point of
our problem definition, were generated by TR-ARCHITECT [3]
for a given SOC and given maximal TAM width  . We assumed
that all modules are at the same level of design hierarchy,
just below the SOC itself (despite what is specified in [6]), and we
only considered the module-internal tests. Due to lack of space,
this paper only presents results for SOC p22810, but similar results
were obtained for other benchmark SOCs and published in [17].
. We assumed
that all modules are at the same level of design hierarchy,
just below the SOC itself (despite what is specified in [6]), and we
only considered the module-internal tests. Due to lack of space,
this paper only presents results for SOC p22810, but similar results
were obtained for other benchmark SOCs and published in [17].
Table 1(a) presents the expected test time results for the three different
abortable units:  for module tests,
  for patterns, and
  for clock cycles. For this
table, no particular scheduling algorithm was used; the schedule
that was analyzed is the lexicographically-sorted non-preemptive
test schedule delivered by TR-ARCHITECT. Furthermore, we
considered a curved pass probability distribution between patterns,
and a flat pass probability distribution between clock cycles
within a pattern. Column 1 lists the pass probability set used ( or )
and Column 2 lists the maximal TAM width specified (). Column 3
presents the completion time
for clock cycles. For this
table, no particular scheduling algorithm was used; the schedule
that was analyzed is the lexicographically-sorted non-preemptive
test schedule delivered by TR-ARCHITECT. Furthermore, we
considered a curved pass probability distribution between patterns,
and a flat pass probability distribution between clock cycles
within a pattern. Column 1 lists the pass probability set used ( or )
and Column 2 lists the maximal TAM width specified (). Column 3
presents the completion time  obtained by TR-ARCHITECT,
i.e., without abort-on-fail. Columns 4, 6 and 8 list the expected
time , and for the various abortable units. Columnts 5, 7, and 9 show the relative difference
between the expected test time and the completion time
.
obtained by TR-ARCHITECT,
i.e., without abort-on-fail. Columns 4, 6 and 8 list the expected
time , and for the various abortable units. Columnts 5, 7, and 9 show the relative difference
between the expected test time and the completion time
.
| Pass |
|
|
| Prob. |
|
|
| Set |
|
[3] |
|
|
16
|
458068
|
|
24
|
299718
|
|
32
|
222471
|
|
|
40
|
190995
|
|
48
|
160221
|
|
56
|
145417
|
|
64
|
133405
|
|
|
16
|
458068
|
|
24
|
299718
|
|
32
|
222471
|
|
|
40
|
190995
|
|
48
|
160221
|
|
56
|
145417
|
|
64
|
133405
|
|
|
|
Abortable Unit
|
|
Module Test
|
Test Pattern
|
Clock Cycle
|
|
|
(-)/
|
|
(-)/
|
|
(-)/
|
|
|
254969
|
-44%
|
230552
|
-50%
|
230487
|
-50%
|
|
170201
|
-43%
|
139366
|
-54%
|
139281
|
-54%
|
|
119506
|
-46%
|
89357
|
-60%
|
89247
|
-60%
|
|
87013
|
-54%
|
66517
|
-65%
|
66459
|
-65%
|
|
84561
|
-47%
|
61623
|
-62%
|
61553
|
-62%
|
|
83019
|
-43%
|
59538
|
-59%
|
59465
|
-59%
|
|
78705
|
-41%
|
57131
|
-57%
|
57074
|
-57%
|
|
|
160126
|
-65%
|
66983
|
-85%
|
66892
|
-85%
|
|
140031
|
-53%
|
14917
|
-95%
|
14808
|
-95%
|
|
103964
|
-53%
|
8364
|
-96%
|
8234
|
-96%
|
|
107216
|
-44%
|
8624
|
-95%
|
8543
|
-96%
|
|
103763
|
-35%
|
6588
|
-96%
|
6506
|
-96%
|
|
94565
|
-35%
|
4950
|
-97%
|
4851
|
-97%
|
|
79514
|
-40%
|
4563
|
-97%
|
4475
|
-97%
|
|
(a)
|
|
Scheduling
|
|
Non-Preemptive
|
Preemptive
|

|
(- )/ )/
|

|
(-)/
|

|
(-)/
|
|
|
135542
|
-41%
|
459860
|
+0.4%
|
123823
|
-9%
|
|
85983
|
-38%
|
301485
|
+0.6%
|
80582
|
-6%
|
|
66120
|
-26%
|
223605
|
+0.5%
|
61985
|
-6%
|
|
55980
|
-16%
|
190995
|
0.0%
|
52339
|
-7%
|
|
45891
|
-26%
|
160221
|
0.0%
|
43805
|
-5%
|
|
41345
|
-31%
|
145417
|
0.0%
|
39442
|
-5%
|
|
37694
|
-34%
|
133405
|
0.0%
|
35981
|
-5%
|
|
|
18636
|
-72%
|
459860
|
+0.4%
|
10361
|
-44%
|
|
11443
|
-23%
|
301485
|
+0.6%
|
6843
|
-40%
|
|
6422
|
-23%
|
223605
|
+0.5%
|
4860
|
-24%
|
|
5120
|
-41%
|
190995
|
0.0%
|
4072
|
-20%
|
|
4409
|
-33%
|
160221
|
0.0%
|
3479
|
-21%
|
|
3779
|
-24%
|
145417
|
0.0%
|
3101
|
-18%
|
|
3548
|
-22%
|
133405
|
0.0%
|
2813
|
-21%
|
|
(b)
|
Table 1: For SOC p22810, test time results for (a) three different abortable unit sizes, and (b) non-preemptive and preemptive test scheduling.
In Table 1(a), we see that for decreasing abortable units, the expected
test time decreases. For some TAM widths, the savings in
test time are up to 97%. The savings obtained for set are larger
than the savings for set , due to the fact that set has lower pass
probabilities then set . The cycle-based calculations are the most
accurate ones, but also require more compute time (up to five times more for SOC p22810) then the test- or
pattern-based calculations. As the differences in expected test
time for pattern- and cycle-based units are insignificantly small,
we recommend to use patterns as the abortable unit.
Table 1(b) shows test time results obtained using the test scheduling
algorithms presented in Section 5. Here, we used clock cycles
as the abortable unit, in order to obtain the most accurate results.
Column 2 lists the relative difference in expected test time
between our non-preemptive scheduling algorithm and the lexicographical
schedule delivered by TR-ARCHITECT . Columns 4 and 6 represent the
relative differences in completion time and expected test time
between our preemptive and non-preemptive scheduling algorithms.
In Table 1(b), we see that our non-preemptive scheduling
algorithm obtains savings in expected test time up to 41% for
set and 72% for set . Our preemptive scheduling algorithm
brings additional savings up to 44% in expected test time, at the
(marginal) expense of <1% increase in completion time. The latter is due to the fact that at preemption boundaries in the schedule, we do not allow overlapped scan (see Section 5.2).
7 Conclusion
Modular testing, increasingly applied on complex SOCs, enables
the recording of yield-per-module. In this paper, we used the
yield-per-module to exploit the abort-on-fail feature of ATEs, in
order to reduce the expected test application time. Working with
module tests, patterns, and individual clock cycles as abortable
units, we have presented a model to compute the total expected
test application time. The expected test application time decreases
and becomes more accurate with decreasing abortable unit sizes.
Subsequently, we addressed the problem of test scheduling for a
given modular test architecture consisting of wrappers and disjunct
TAMs, such that the total expected test time is minimized.
For this problem, we presented two heuristic scheduling algorithms,
one without and one with preemption. Experimental results
for the ITC'02 SOC Test Benchmarks demonstrate the effectiveness
of our approach. We show that by just decreasing the
abortable unit size, up to 97% reduction of the expected test time
can be achieved. The use of our non-preemptive heuristic scheduling
algorithm results in additional savings in expected test time up
to 72%. Our preemptive scheduling algorithm brings even further
additional savings in the total expected time, up to 44%, at an expense
of <1% in overall completion time. All results only require
rescheduling of tests, and no modifications to SOC or ATE.
Acknowledgements
We thank Jan Korst, Wil Michiels, André Nieuwland, Bart Vermeulen,
and Harald Vranken of Philips Research and Julien
Pouget of LIRMM for fruitful discussions during the project.
References
[1] Yervant Zorian, Erik Jan Marinissen, and Sujit Dey. Testing
Embedded-Core Based System Chips. In Proceedings
IEEE International Test Conference (ITC), pages 130-143,
Washington, DC, USA, October 1998.
[2] Sandeep Kumar Goel and Erik Jan Marinissen. Effective and
Efficient Test Architecture Design for SOCs. In Proceedings
IEEE International Test Conference (ITC), pages 529-538,
Baltimore, MD, USA, October 2002.
[3] Sandeep Kumar Goel and Erik Jan Marinissen. SOC Test
Architecture Design for Efficient Utilization of Test Bandwidth.
ACM Transactions on Design Automation of Electronic
Systems, 8(4):399-429, October 2003.
[4] Erik Jan Marinissen et al. On IEEE P1500's Standard for
Embedded Core Test. Journal of Electronic Testing: Theory
and Applications, 18(4/5):365-383, August 2002.
[5] Francisco DaSilva, Yervant Zorian, Lee Whetsel, Karim
Arabi, and Rohit Kapur. Overview of the IEEE P1500
Standard. In Proceedings IEEE International Test Conference
(ITC), pages 988-997, Charlotte, NC, USA, September
2003.
[6] Erik Jan Marinissen, Vikram Iyengar, and Krishnendu
Chakrabarty. A Set of Benchmarks for Modular Testing of
SOCs. In Proceedings IEEE International Test Conference
(ITC), pages 519-528, Baltimore, MD, USA, October 2002.
[7] Y.-H. Lee and C.M. Krishna. Optimal Scheduling of Signature
Analysis for VLSI Testing. In Proceedings IEEE International
Test Conference (ITC), pages 443-451, September
1988.
[8] Y.-H. Lee and C.M. Krishna. Optimal Scheduling of Signature
Analysis for VLSI Testing. IEEE Transactions on
Computers, 40(3):336-341, March 1991.
[9] Scott D. Huss and Ronald S. Gyurcsik. Optimal Ordering
of Analog Integrated Circuit Tests to Minimize Test Time.
In Proceedings ACM/IEEE Design Automation Conference
(DAC), pages 494-499, June 1991.
[10] Wanli Jiang and Bapiraju Vinnakota. Defect-Oriented Test
Scheduling. In Proceedings IEEE VLSI Test Symposium (VTS), pages 433-438, Dana Point, CA, USA, April 1999.
[11] Wanli Jiang and Bapiraju Vinnakota. Defect-Oriented Test
Scheduling. IEEE Transactions on VLSI Systems, 9(3):427-
438, June 2001.
[12] Sandeep Koranne. On Test Scheduling for Core-Based
SOCs. In Proceedings International Conference on VLSI
Design, pages 505-510, Bangelore, India, January 2002.
[13] Vikram Iyengar, Krishnendu Chakrabarty, and Erik Jan
Marinissen. Co-Optimization of Test Wrapper and Test Access
Architecture for Embedded Cores. Journal of Electronic
Testing: Theory and Applications, 18(2):213-230,
April 2002.
[14] Erik Larsson, Julien Pouget, and Zebo Peng. Defect-Aware
SOC Test Scheduling. In Proceedings IEEE VLSI Test Symposium (VTS), pages 359-364, Napa Valley, CA, USA, April
2004.
[15] Michael Pinedo. Scheduling - Theory, Algorithms and Systems.
Prentice Hall, New Jersey, NJ, USA, 1995.
[16] Erik Jan Marinissen, Sandeep Kumar Goel, and Maurice
Lousberg. Wrapper Design for Embedded Core Test. In Proceedings
IEEE International Test Conference (ITC), pages
911-920, Atlantic City, NJ, USA, October 2000.
[17] Urban Ingelsson, Sandeep Kumar Goel, Erik Larsson, and Erik Jan Marinissen. Test Scheduling for Modular SOCs in an Abort-on-Fail Environment - Web Site, http://www.ida.liu.se/~eslab/soctest/urban/.
Footnotes
¹ A feasible schedule is called non-delay if no TAM is kept idle while there is a test available for execution on that TAM [15].